
Pipeline and analysis status
Check processing coverage, queues, and transaction-level evidence.
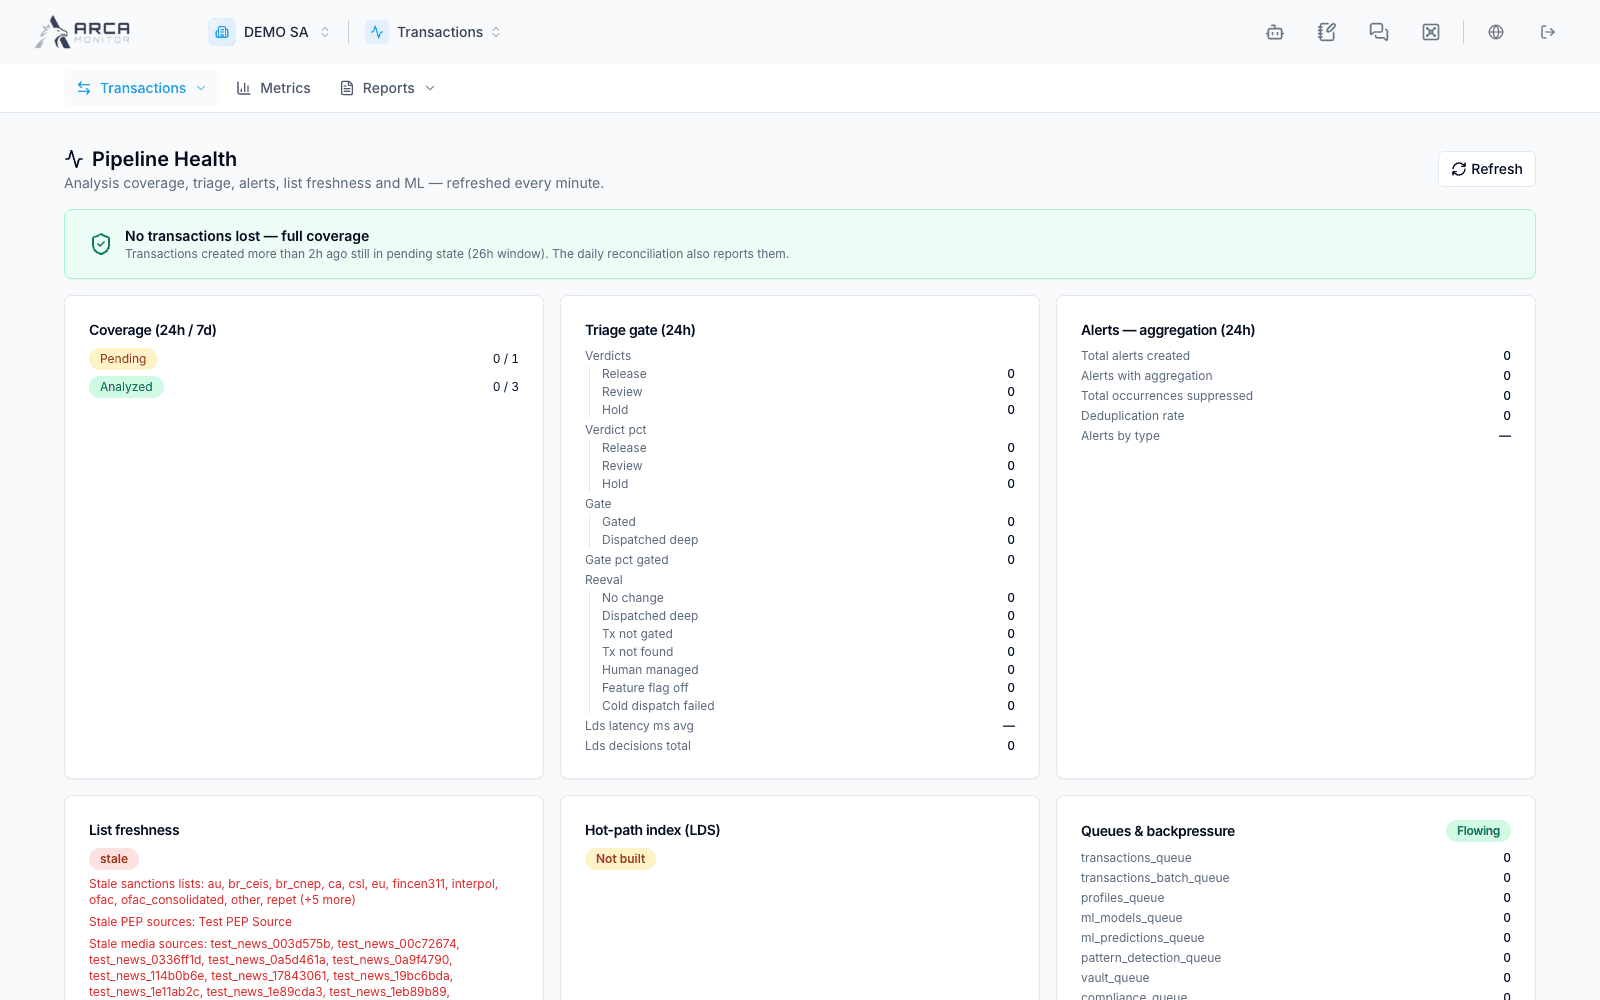
Open Transactions → Pipeline to inspect processing health for the workspace. This is an operational summary; use the transaction reference to inspect one operation in detail.
Read the scope and freshness
Choose the available 24-hour or seven-day window and read the last-refresh information. Coverage counts distinguish records awaiting analysis from those with recorded results. The page also reports triage outcomes, gating and re-evaluation, import activity, reconciliation, queues and active models. List freshness can show stale data in a development environment; read that state before relying on its counts.
A queue length or pending count is unfinished work. An unavailable model baseline, skipped check or missing result is not a passed control. The page refreshes periodically, but a quiet display does not prove that a job has stopped.
Follow up on a specific record
- Copy or retain the transaction reference from the source record.
- Open Transactions → View all, search for it and open the detail.
- Read Overview → Pipeline and Risk Analysis together. In the demo, “Not run” and “Not yet computed” qualify the displayed summary score.
- Use Audit to inspect recorded processing and user events. Check dates and whether evidence belongs to the current evaluation.
- If the record came from an import, inspect History for its row outcome. Import completion and downstream analysis completion are separate.
- Give the responsible administrator the reference, observed state, relevant import and error text when intervention is needed.
See Actions and follow-up for the available re-analysis and review controls.