Metrics, reports, and exports
Choose a dashboard, filtered data export, or generated report for your task.
Transactions provides three different ways to take information away from an individual record: period-based analysis in Metrics, a filtered table export, and generated reports under Reports. Start by deciding which question you need to answer.
Explore Metrics
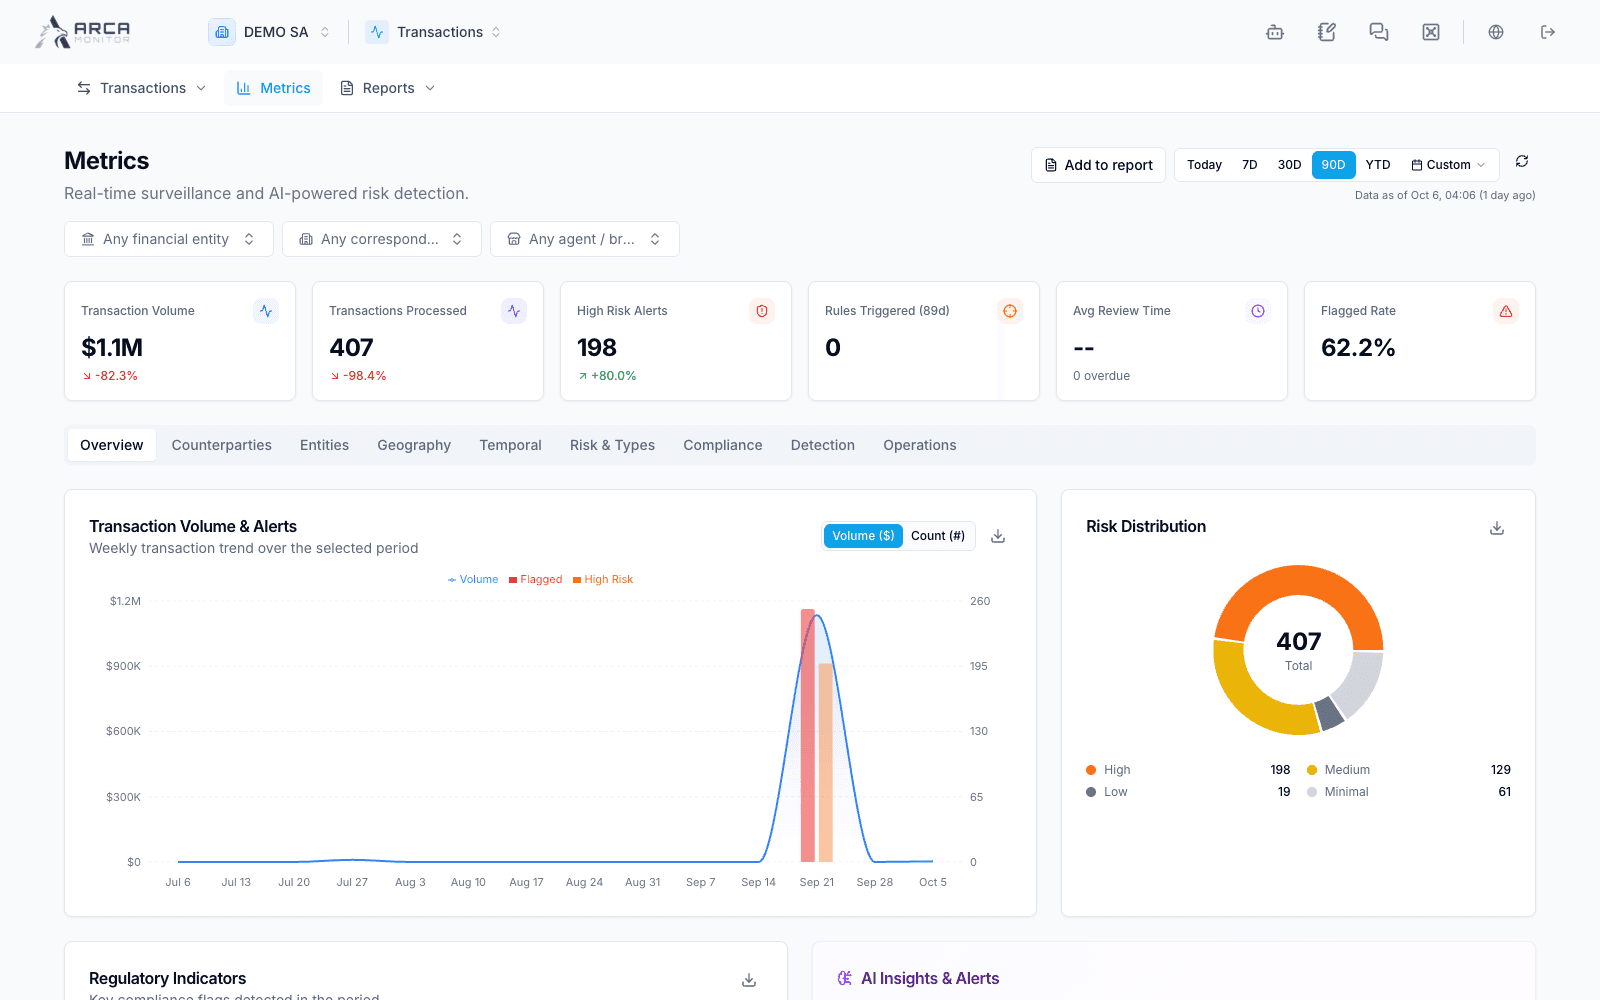
Open Metrics, choose a period, and apply the relevant entity filters. Available period controls include recent days, year to date, and a custom date range.
Move between the dashboard areas for Overview, Counterparties, Entities, Geography, Temporal, Risk & Types, Compliance, Detection, and Operations. Check the active period and filters whenever comparing charts or sharing conclusions.
A chart’s available controls can include CSV, PNG, SVG, or an option to attach information to a case. Use the options actually offered for that chart and your workspace. A chart export represents its displayed scope; it is not automatically the transaction list’s selected records.
Export the transaction list
- Open Transactions → View all and apply the intended search and filters.
- Check that the filtered results are the dataset you intend to export.
- Open the export menu and choose CSV or Excel.
- Review the personal-data option. Full identifiers require the Export personal data permission and the Include full personal data option. Otherwise, sensitive identification values are masked according to the export behavior.
- Download and inspect the file’s columns, scope, and expected content before sharing it through your organization’s approved channel.
Filtered results, not checked rows
The table export covers the active filtered list, subject to the server’s export limit. Selecting a few rows does not narrow this export to those rows. Narrow the actual filters when you need a smaller dataset.
If the platform reports too many rows, reduce the filter scope or use the Transaction Performance Report available through Reports. Do not assume that a failed or limited export contains the entire dataset.
Generate and follow a report
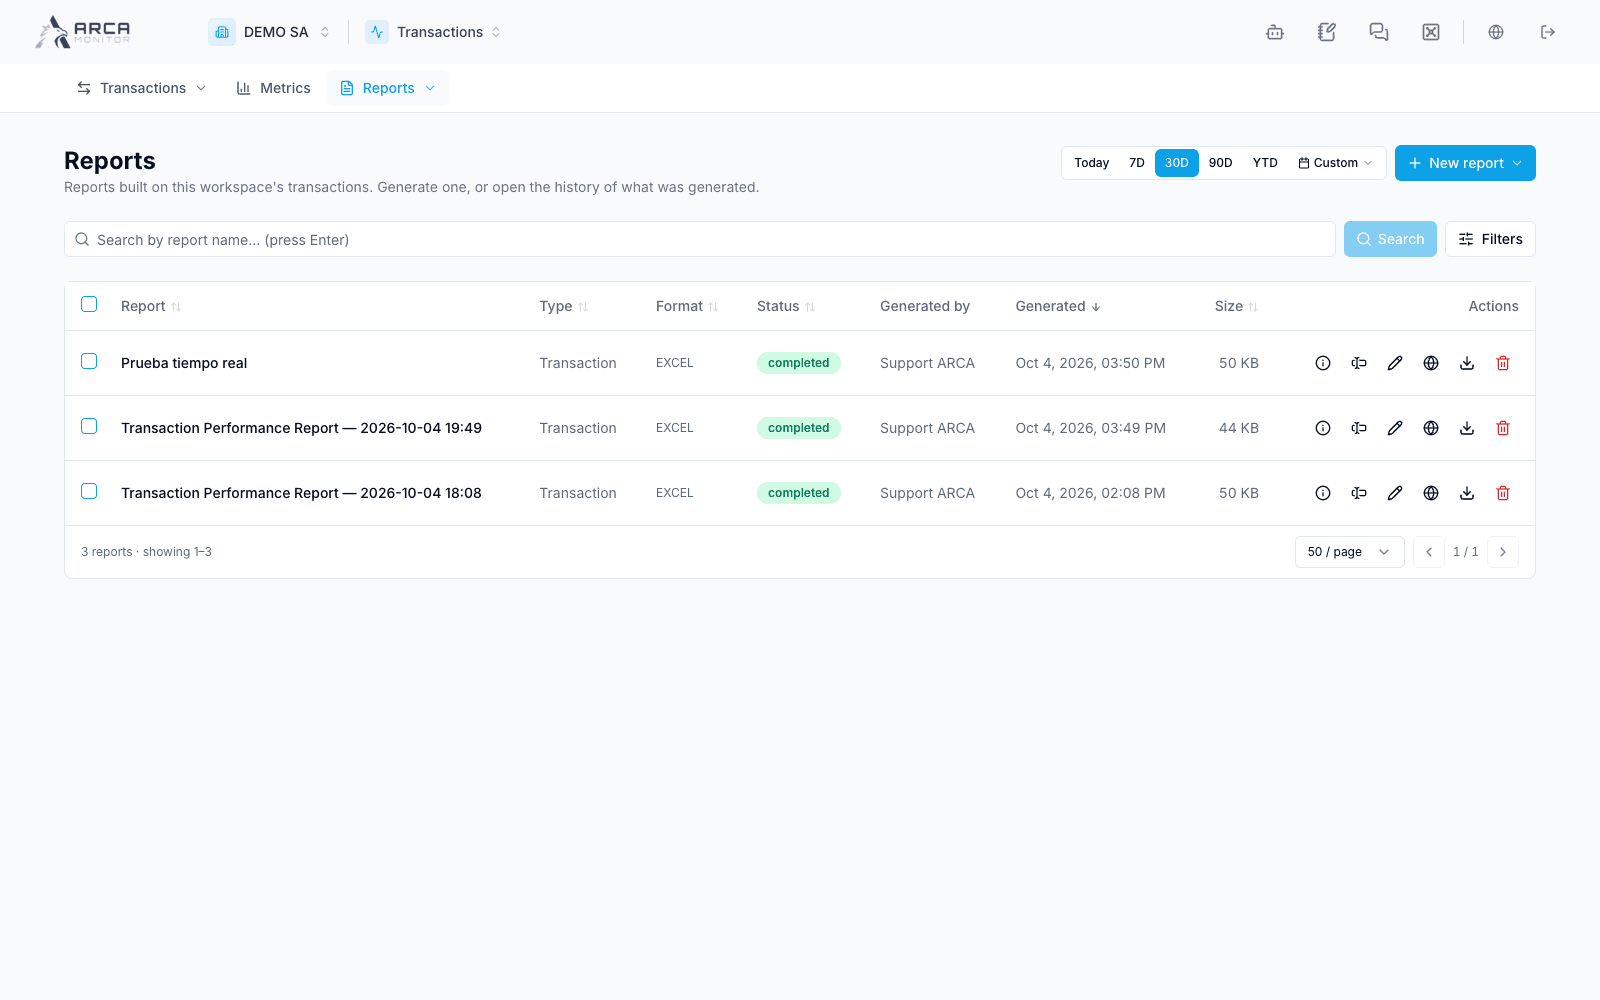
Open the Reports menu within Transactions. Each available report opens its own history; All reports shows the app’s report history. The report cards are in the reporting Library.
On a specific report’s history, use the available generation action to open its parameter dialog. Review the report’s period, filters, and common settings, then submit. Generation is asynchronous: follow the report entry until the output is ready, or inspect its error if it fails.
Open or download the completed output through the available action. Verify its parameters and generation time before using it in a handoff. A previously generated report can represent a different period from the dashboard currently on screen.
Choose the right output
| Need | Appropriate starting point |
|---|---|
| Understand trends for a period | Metrics with the relevant filters. |
| Work with the filtered transaction table | CSV or Excel list export. |
| Produce a report with named parameters and history | A Transactions report and its generation dialog. |
| Prepare a regulatory workflow | The eligible regulatory action and the resulting report’s own review process. |
Creating an analytical report, creating a regulatory draft, and submitting a regulatory filing are different outcomes. Follow the status of the resulting item; downloading a file alone does not establish submission.
If you need to explain an unexpected count, first compare workspace, date basis, filter scope, and report generation time. Use Search and filters to inspect the underlying transactions.
Screens and controls
Metrics use their own period and filters
Transaction report history
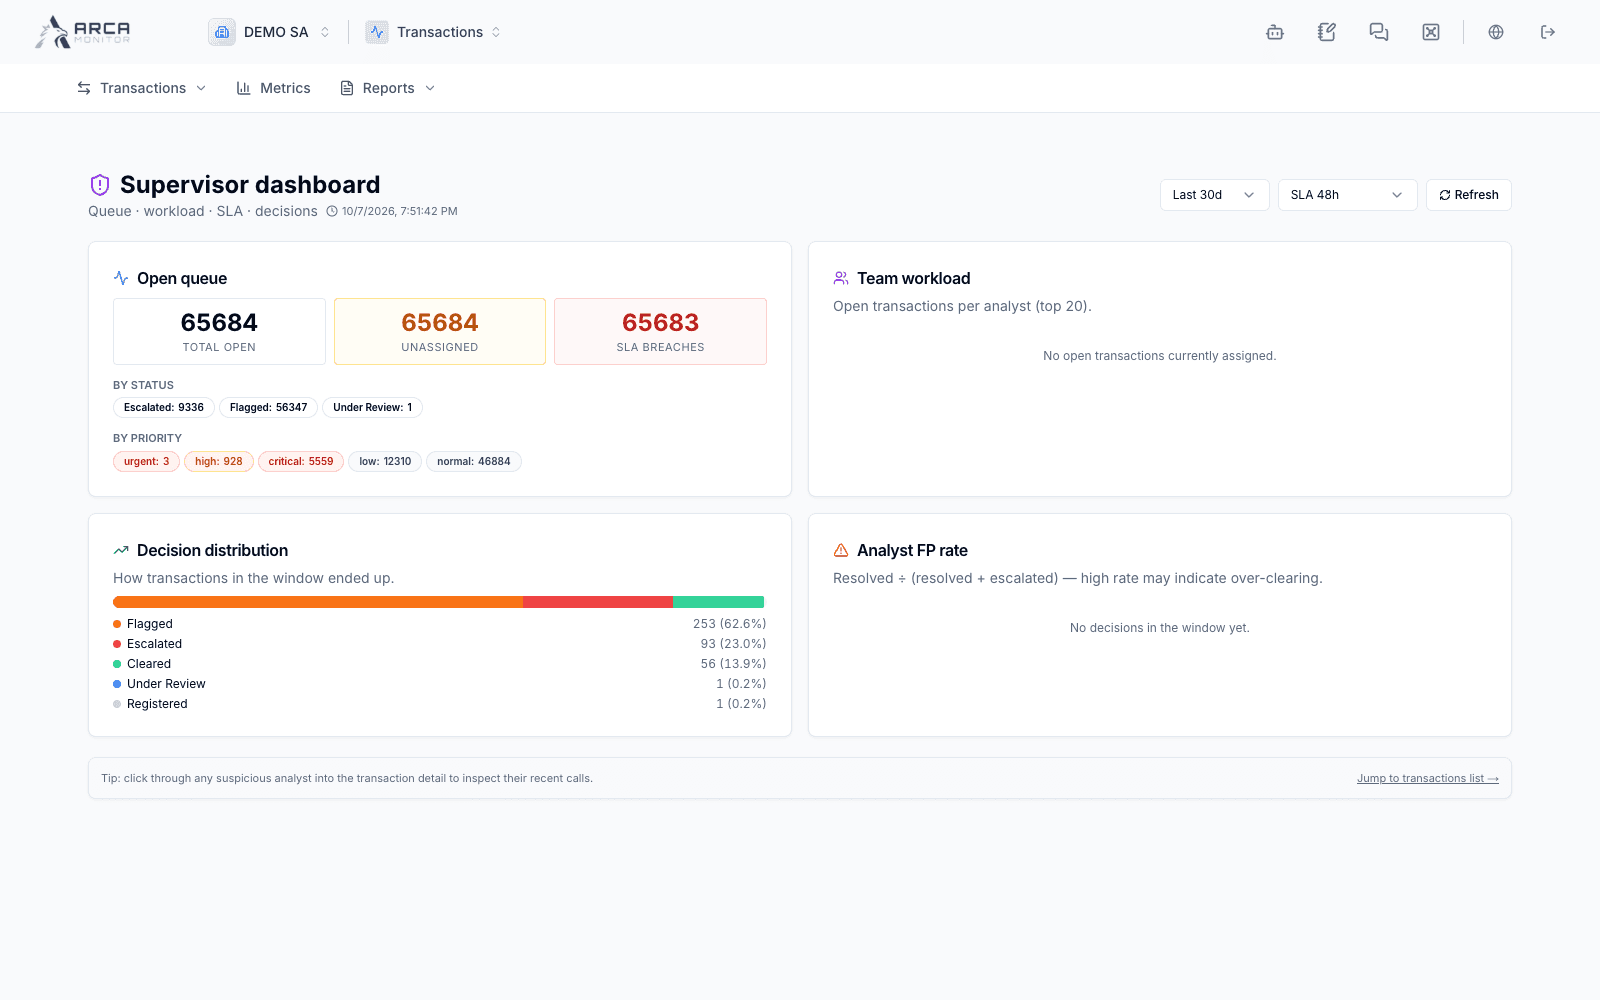
Supervisor view: queue, workload, SLA and decision distribution